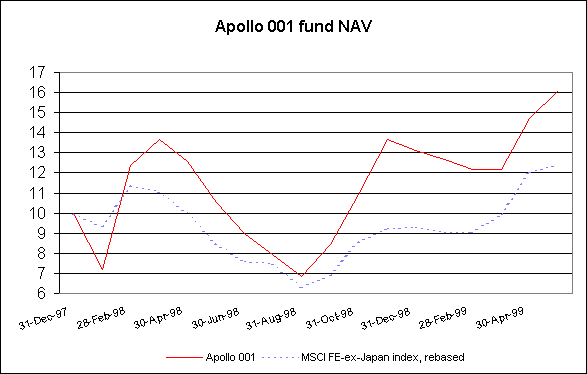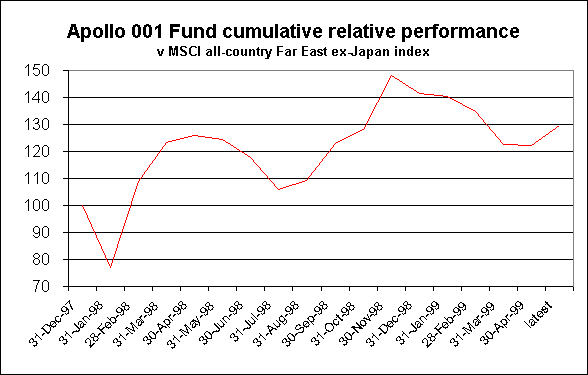

Panic buying of Asian markets by underweight institutions, coupled with savings rates which are unprecedented even by Asian standards and very low local interest rates, have driven the Singapore index and many Hong Kong big-caps to pre-crisis highs. For non-momentum investors, this can be justified only in relation to bubble prices in the US and Europe. Hong Kong now has very positive real interest rates, and Singapore may get every policy move spot-on but now has the neighbours from hell.
Having failed to participate in the first quarter, our small-cap portfolio
has recently been keeping pace, with shares often quiet for long periods
and then popping up as results come out or an institutional investor suddenly
"discovers" a new name. The NAV is now $16.09, having risen 10% in the
last four trading days.


NAV is up by just over 60% in the sixteen-odd months since the beginning of 1997, and the cumulative outperformance now stands at a respectable 28% over the same period.
Importantly, however, the intrinsic value in our portfolio remains highly attractive: the ordinary shares are on a current year PE of 7.2, reducing to 6.1 in the following year (on our own estimates, which tend to conservatism), and a current-year net dividend yield of 6.5%, rising to 7.2% in the following year. The overall portfolio, including one high-yielding bond but also including warrants and one defaulted bond, has an expected after-tax dividend yield of 7.1% for this year, rising to 7.8% next. These valuations have risen by less than the NAV performance, as the last two companies to report for the years to Dec 98 and Jan 99 came in ahead of our expectations, and we have gradually been selling some of our best performers - such as one share which has risen four-fold since purchase - to buy equally good or better companies which have nevertheless lagged the market and are much cheaper (double-digit net dividend yields, or sub-4 PE's).
The portfolio mix is as follows: we'd emphasise that it has arisen
from bottom-up stock selection, not from any pre-conceived ideas of asset
allocation.
| Apollo 001 Fund portfolio by class of security: | by geography | % of total portfolio | |||||||
| Ordinary shares | 84.7% | Hong Kong | 39.4% | ||||||
| Closed end fund | 0.5% | Malaysia | 28.1% | ||||||
| Warrants | 3.7% | Singapore | 13.2% | ||||||
| Bonds | 13.7% | Thailand | 11.0% | ||||||
| Cash & net receivables | -2.5% | Other | 8.3% | ||||||
| 100.0% | 100.0% |
|
|
|
|
|
|
|
|
|
|