NAV of the Apollo Asia Fund rose 2.4% in the second quarter, to US$2,673.62 (Series A); it was up 3.2% year-to-date. It's up 27% since December 2019, and 66% since the end of March 2020, when global markets had begun to rally after the initial pandemic slump. Over the 25-plus years since inception, compound annual growth has been 17%, and the NAV has multiplied 55-fold.
|
It was a quarter in which we announced a co-management agreement, asked investors for their approval, and a month later had to announce its cancellation after Seraya Investment Pte Ltd, the Singapore company run by some former colleagues, decided not to proceed. Their decision-making and communication styles are apparently very different from ours, and it was bracing to discover this so suddenly, but better now than later. There has therefore been no change at Apollo Asia Fund: it will continue to be managed by AIMS Asset Management, with me as the fund manager, as since inception.
More importantly, this was a quarter in which extraordinarily high temperatures were recorded in many places around the world, on land and at sea. Climate change is no longer a distant risk, beyond the investment horizon, as it was for so much of my career. It is upon us now, and the effects on agricultural production, and the birth death and migration patterns of humans and the myriad species on which we depend, are hard to forecast.
Meanwhile, precipitous declines were reported in the population of too many living species - birds, insects, sea creatures - a 50% loss here, 90 or 98% there - painting a picture of severe environmental stress. How many actors can be lost to individual ecoystems before they buckle? We rarely know, and the precautionary principle would suggest that we avoid all such risks by preventing further losses, but our societies are far from being so decisive or effective. Meanwhile the bird flu, after sweeping through many populations of wild as well as captive birds, is affecting a growing variety and number of mammals, including dogs, cats and dolphins. Viruses appear to be doing well.
There are good reasons to worry that the next fifty years may be very different from the last fifty:
|
In crises there are always opportunities for some. Ireland is booming, as an English-speaking base within Europe; Turkey and the Middle East have a number of beneficiaries from the Russian situation. However the countries and companies that benefitted from the decades of peace, globalisation and ready supplies of energy are not necessarily in a position to benefit from the unwinding. Nor are the new opportunities necessarily structured in ways suitable for stockmarket investors. (For those which are, sales pitches should as always be carefully scrutinised.) We cannot count on the same abundance of investible opportunities as in the past, but we'll keep looking - and our fund needs only a few.
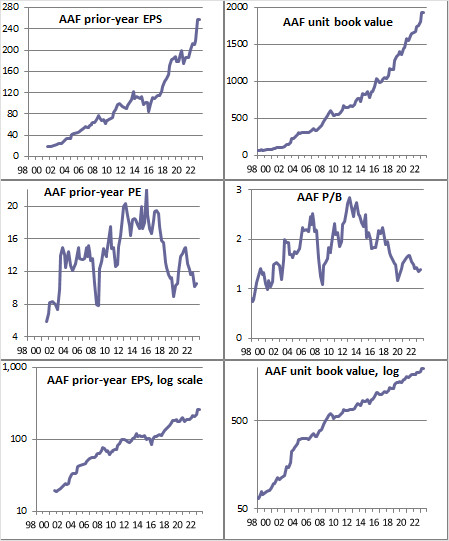
After that long list of cautions about the decades ahead, it will be clear that the past will not necessarily provide a reliable guide to the future. However, I find it quite remarkable to see how smooth the upward march of portfolio earnings and book value has been over the last quarter century. These indicators are shown in the first line of charts, and measure the fundamental value of the businesses underlying each portfolio share. This period has not been uneventful in Asia: think of the changes in Hong Kong and Thailand in particular, as these have been major markets, and Russia - and all the volatility and disruption of the pandemic! Some of our holdings suffered badly, so this outcome highlights the value and potential resilience of a portfolio of sensible businesses.
How the stockmarket values those assets is more volatile. The overall price-earnings and price-book ratios for the portfolio are shown in the second line of charts. At the end of the quarter, the historic PE was 10.6, P/B 1.4, and the estimated current-year dividend yield a net 4.1%. Market prices now offer reasonable value: in the last twenty years, our portfolio valuations have rarely been much lower.
Line three shows the growth in earnings and book value per share on a log scale, to highlight the rates of growth: slower post-08 than before, but still respectable. Over the last 10 & 15 years, the portfolio EPS & BVPS have both compounded in US$ terms at annual rates of around 10%.
Amid the uncertainties ahead, we'll still attempt to preserve and build purchasing power by investing in well-managed businesses. We have always valued resilience, but will now be thinking about the ability to survive and adapt in scenarios which others might consider extreme. We'll exclude many businesses which seem unsustainable in the long run, however mainstream their sectors may be today. We'll also be wary of businesses which do too much environmental damage, and thrive only because this is not properly costed; this could account for a significant proportion of today's listed companies. Even if the likelihood of effective government action transforming the economics of those sectors seems low, let's see if we can instead invest sensibly in businesses of the types that we'd like to see thriving in the decades to come.
We'll look for strong survivors at a reasonable price, as well as valuation anomalies among honestly-run businesses. We welcome reader suggestions on resilient business models, reliable management teams, and opportunities of interest. We expect big waves ahead and hope to keep bobbing up after they pass. Please wish us luck; may we continue to prosper together.
Claire Barnes, 26 July 2023
| Home | Investment philosophy | Fund performance | Reports & articles | *What's new?* |
| Why Apollo? | Who's Claire Barnes? | Fund structure | Poetry & doggerel | Contacts |