Fund performance
This page will give the monthly performance data, using official valuations. More recent updates, including NAV estimates by the fund manager, may sometimes be found at What's New?
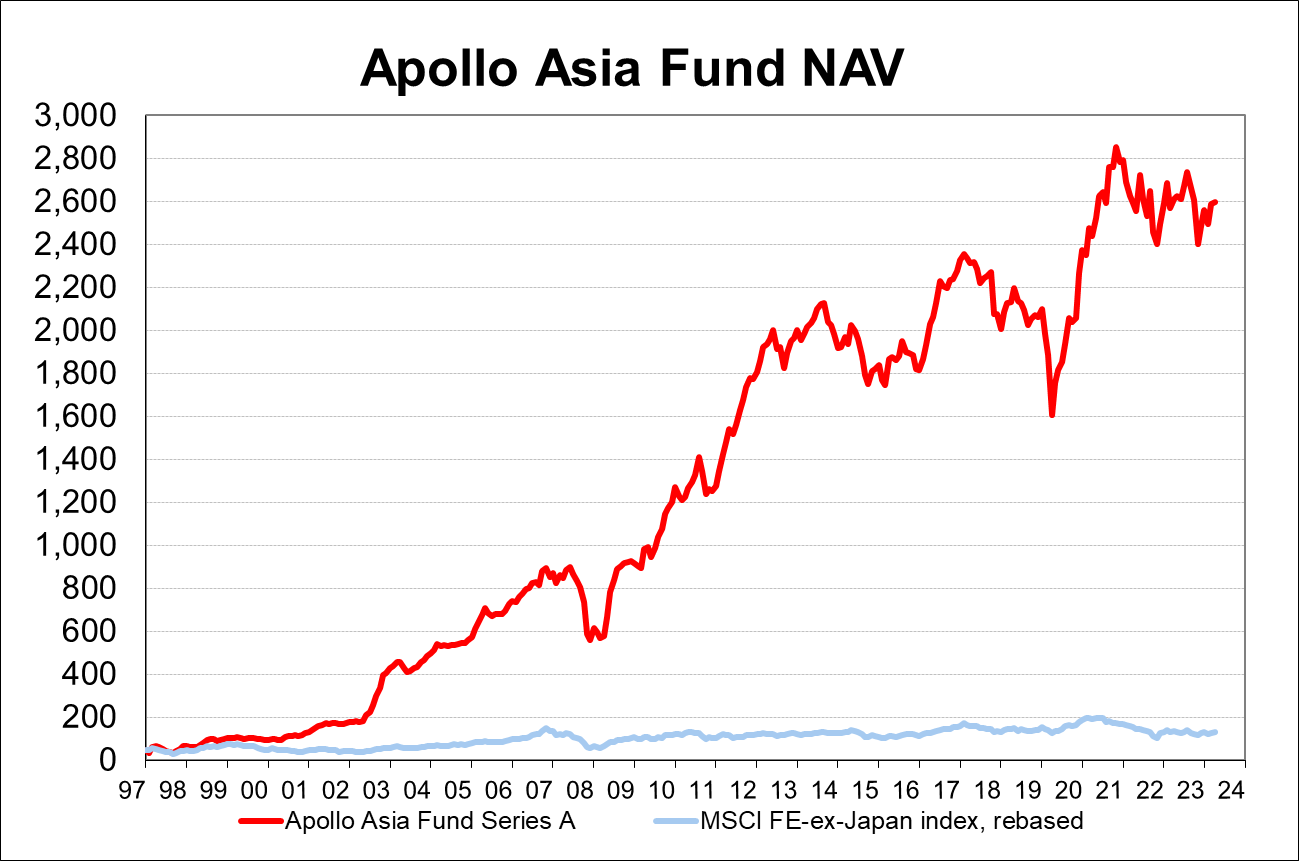 |
The first chart shows the absolute investment performance of the Apollo Asia Fund Series A Investor Shares, up to the end of December 2024. The Net Asset Value per Share has been linked to the rebased NAV of the predecessor Apollo 001 portfolio, which had the same investment style, started at the end of 1997, and was folded into the new fund at US$100 on 30 Nov 1999.
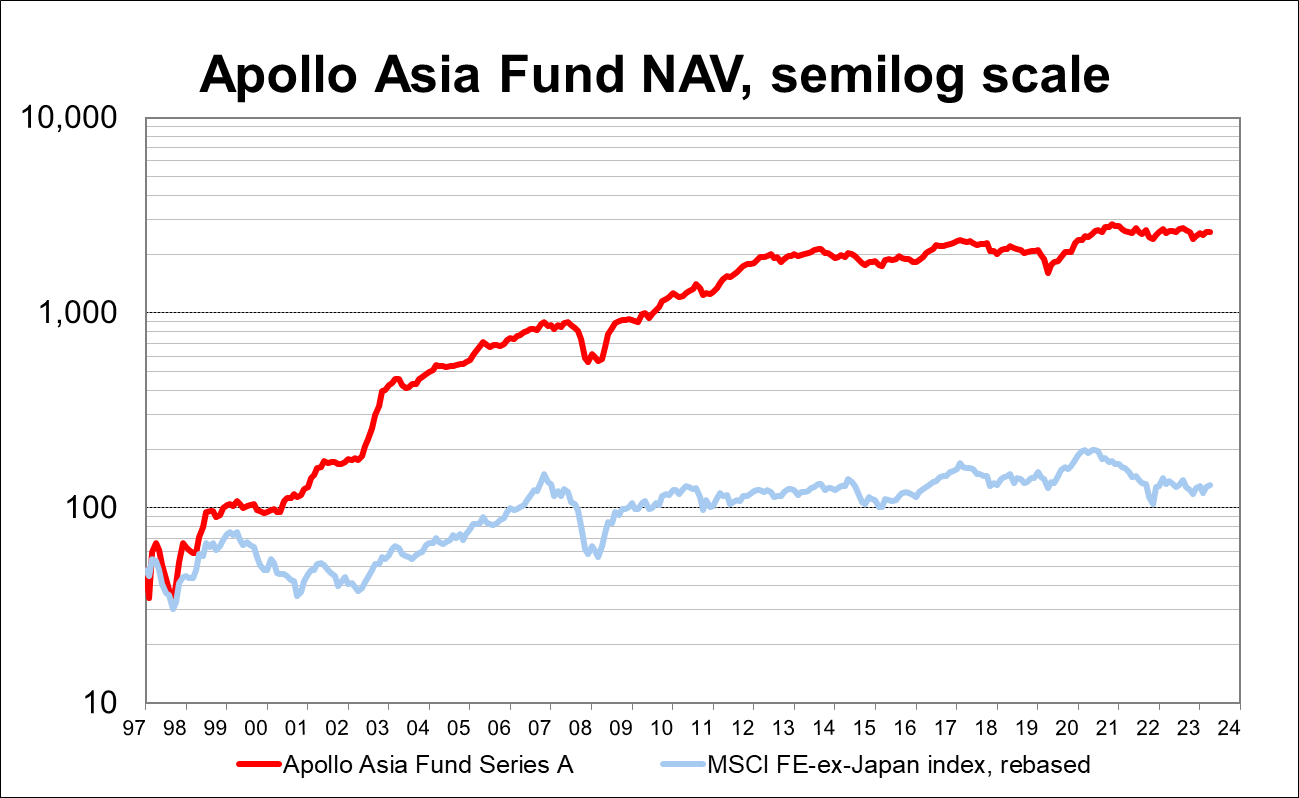
The NAV at end-Dec was US$2,904.26, a new high. It was up 0.9% for the month, and 13.4% for the year. It's up 38% over the five years since December 2019, before most of us heard of SARS-CoV-2, and 81% from the end of March 2020. NAV is up 60-fold over the twenty-seven years since inception; annual compound growth over this longer period has been 16.4%. Charting NAV on a semilog scale puts the recent performance and the longer history in context.
Amid intensifying environmental, political and health crises, business continues. A diversified portfolio of companies chosen for resilience and sensible management remains a logical way to attempt to preserve purchasing power.
Net asset value of the Apollo Asia Fund is calculated after fees and the 15% incentive allocation. No management fees were charged against NAV of the 1997-1999 portfolio.
The Fund is managed for absolute returns, and not by reference to an index or peer group. The Fund typically has a concentrated portfolio of shares selected on a bottom-up basis, and the geographical mix has changed considerably over time.
 |
We show an index just to give some idea of broad stockmarket direction in the region. Index movements often explains much of the volatility from month to month, even though our portfolio mix may be very different. The index however excludes dividends, a major factor in long term returns. The index we have used is the MSCI all-country Far East ex-Japan index, a fairly broadly-based index denominated in US$ but comprising mainly large-cap stocks. From Nov 2001 we had to change to the 'free' index, which weights stocks according to estimated free float, rather than the index weighted by market capitalisation which we used earlier, and which MSCI discontinued. The two tracked each other fairly closely during 2001, and indeed since inception in the mid-80's, so we chained the two series at the end of October 2001.
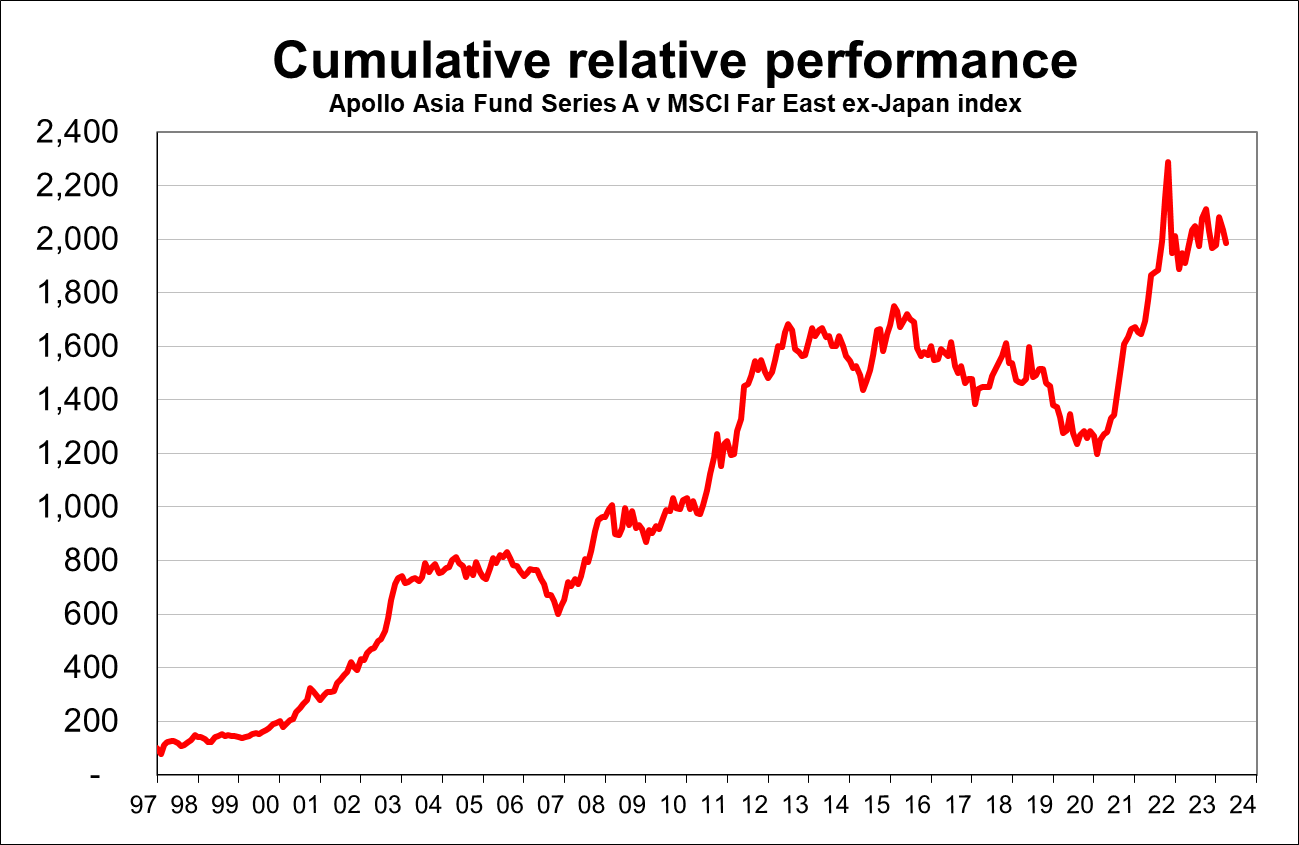
The second chart shows the relative performance of the Fund against the regional index. During the Fund's first twenty seven years, the index had ten down-years and seventeen up-years; the Fund had eight down and nineteen up. Historically, the fund has often underperformed in the late stages of bull markets (with NAV still rising), but outperformed in the following bear (with NAV falling, but by less than others) - and the seeds of future growth have often been sown in depressed or chaotic markets, which offer more opportunities than complacent ones. Many risks are now globally evident, but a portfolio of well-run businesses, diversified by sector and geography, still seems a sensible place to try to ride out storms and inflation. We'll continue to hope in the capabilities and integrity of those who manage our businesses, and to focus on quality and value as we evaluate new opportunities. Ideas from our investors are, as always, welcome.
The raw data is on a separate page: monthly NAV figures.
Shareholders taxable in the UK will find reportable income for years starting 2013 linked from this page: UK Reporting Fund Status.