Apollo
Investment Management
More on dollar-cost averaging
In an earlier article, I extolled the merits of dollar-cost averaging,
the practice of committing a fixed sum per month for investment. I have
been asked to elucidate by showing the specific numbers which would have
resulted from a regular commitment. Investors in our new fund will be individuals
of high net worth, or financial professionals, who may be more accustomed
to committing large lump sums, but the arithmetic works regardless of sophistication;
please do not think this is worthwhile only for small savers!
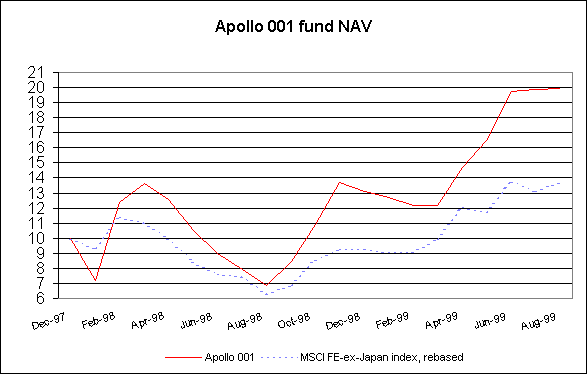
First let's recap with the latest roller-coaster chart: the fund's
net asset value, like the regional stock index, has been highly volatile.
It is reasonable to assume that this volatility will continue.

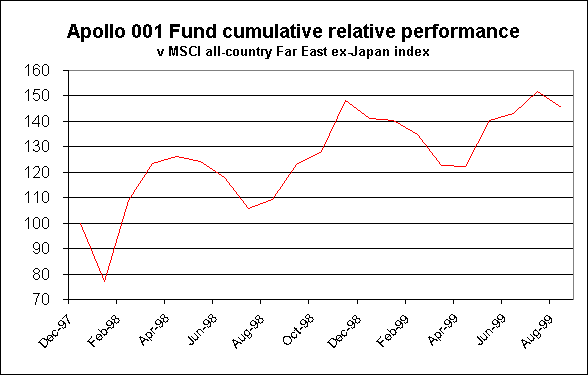
Where that chart goes, I cannot resist adding the relative performance,
since it looks quite respectable. The fund is not managed against
the index, and I could not even tell you the current index weights, but
it is as good an indicator as any of the broad market movements which will
explain much of the month-to-month fluctuation in the fund's market value.

(My apologies if the charts are over-large, but when I reduce them
legibility seems disproportionately compromised. As a webpage beginner,
I use Netscape Composer, and my control over the layout leaves much to
be desired. If any reader would care to provide pointers for improvement,
the suggestions would be most welcome.)
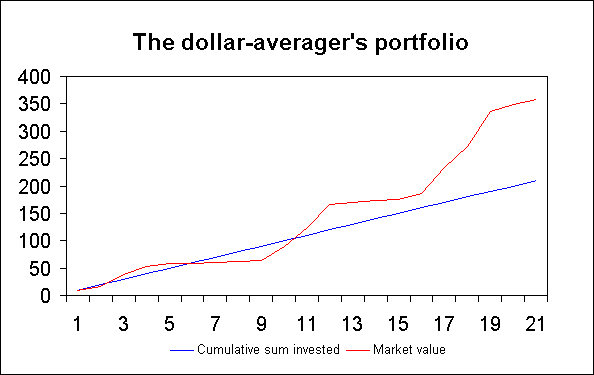
This is a simulation of the portfolio performance which would have been
achieved by a dollar-cost averaging investor in the Apollo 001 Fund, investing
a fixed amount (say US$10,000 per month), for each of the 21 months since
the fund started up on 31 December 1997. The cumulative investment after
21 months would be US$210,000; the net asset value would be US$359,000,
representing a gain of 71% over the whole period (not annualised). The
figures here are after the 1.8% initial charge which has been a feature
of the Apollo 001 Fund and will continue in the Apollo Asia Fund, but before
management and incentive fees which will be levied in the new fund.

The portfolio value would have been below the amount invested for six
months out of the twenty-one, but by percentages less alarming than those
which might have been experienced by a lump-sum investor.
Investors who believe in their timing ability will obviously attempt
to invest at or near a market bottom, and if successful in this they will
naturally beat the dollar-averager. Many of us however are under no illusions
as to our ability in this respect, and if that seems an appalling confession
for a money manager, we can point to the example of great investors such
as Warren Buffett. The investor might quite reasonably have taken a view
that the Asian crisis and recession offered opportunity, that value was
available and the risk/reward balance reasonable, at any time from December
1997 (which was when I myself started to invest on any scale) through to
the present, but that he could not hope to pick the optimal investment
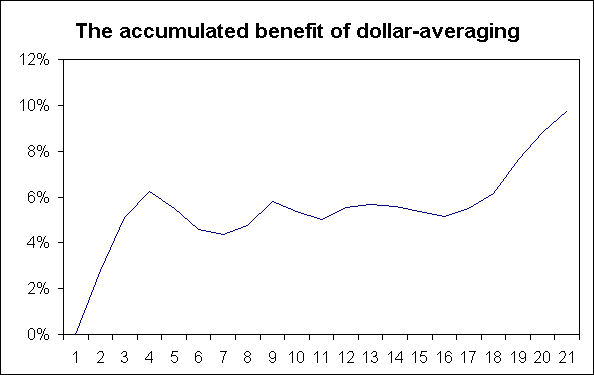
moment more precisely. Because the effect of dollar cost averaging is automatically
to buy more shares or units when prices are low than when they are high,
the averaging investor would at all times have done better than the expected
return of an investor who might have made a lump sum commitment in any
of the months from December 97 to that date, but whose choice of month
would have been random. This chart shows that the dollar-averager's portfolio
has always been greater than the expected value of the lump sum investor's
(to the same extent that his average entry cost is lower), and that the
advantage has risen over time.

Varying the specific assumptions of starting point and the time period
over which the lump sum might be committed will give different results,
but the conclusions tend to be similar.
Psychological advantages are perhaps as important as these statistics.
"Baby steps" reduce the chance of an enormous mistake. The risk of a large
dollar loss is reduced; likewise the risk of missing the market bottom
(when many people are more than usually busy with crisis management, and
the newsflow is abominably dispiriting). A dollar cost averaging programme
cannot guarantee superior performance (if the market goes straight down
with no rebound, or for that matter straight up with no pause, it won't
help), but the probabilities are in favour. Moreover, the greater the volatility,
the greater the benefit. Market volatility is often unsettling for investors,
so this is fortuitous.
There are limits, of course. Sometimes it will be be more appropriate
to commit assets in a lump sum. But for those investors who have regular
cash inflows, concur with us on the intrinsic merits of our portfolio with
its mid-teens earnings yield and 7% net dividend yield (value like this
is not always available), but are nevertheless nervous about the possibility
of short-term valuation losses - dollar cost averaging is one way to go.
The Apollo Asia Fund will be happy to accomodate such investors.
Claire Barnes, 4 September 1999
Previous reports:


