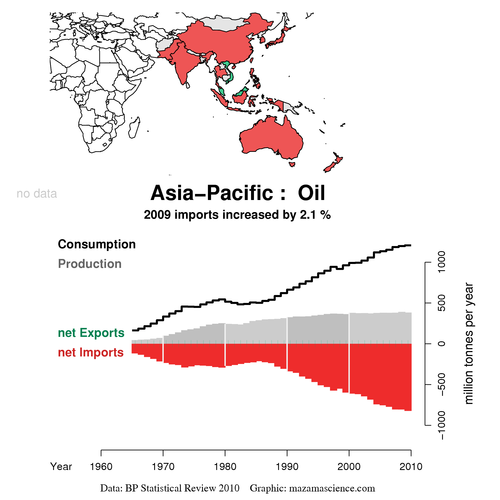
Asia's growing net imports of oil...
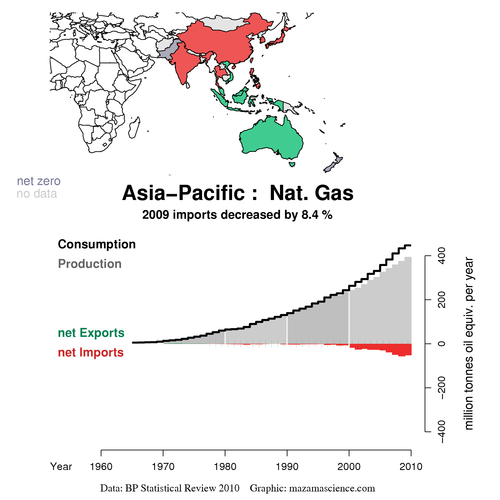
... and of gas
Economic growth dipped in 09, but there is widespread complacency that Asia is now back to 'business as usual'. That would require commensurate growth in the availability of energy. (The energy intensity of US GDP has fallen, but it is far from clear that this would have been the case if manufacturing had not been offshored. It seems far from clear that 'green growth' is possible.) A look at the implications of compound growth, and the levelling / decline of some Asian energy sources, highlights the potential constraint of energy availability. China's energy demands are much in the press, and its government is clearly very aware of energy security. Some other countries appear almost oblivious, having received an energy windfall and forgotten its magnitude, and may be surprised to find that they cannot grow as fast without it.
This article uses charts from the invaluable Energy Export Databrowser: http://mazamascience.com/OilExport/, which is based on the BP Statistical Review. When written, it was based on the 2009 review, using data to 2008. Those charts have since disappeared, so have been updated to the latest versions using data to 2009. However, the text is unchanged. References in this article to "the last 10 years" mean "the 10 years to 2008", etc.

Asia-Pacific energy consumption has in the past been closely correlated with GDP. Over the 10yrs to 2008 it rose 70% - a compound annual rate of 5.2%.
Over the 10 years to 2008, energy usage rose fastest in China: up 2.2 times, compound growth of 8.1%.
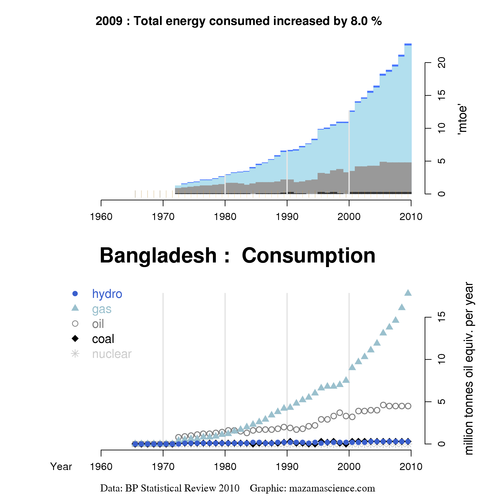
Over 30 years, however, the fastest growth was in Bangladesh, up more than 8 times; consumption by South Korea, Malaysia and Thailand rose more than 7-fold; these figures all represent compound growth rates of around 7% pa.
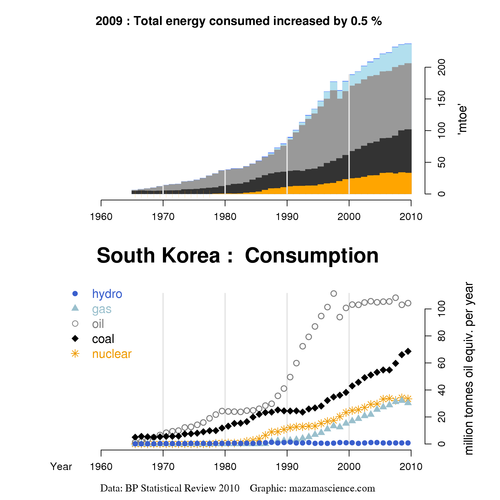
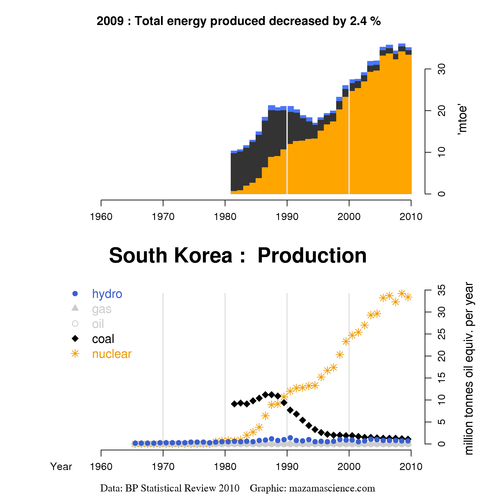
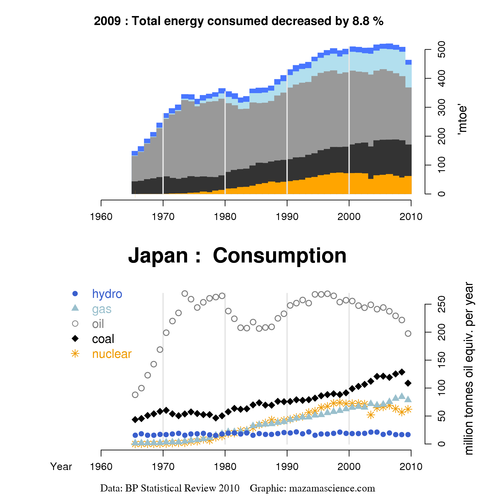
The energy mix varies considerably. China has the highest dependence on coal, 70% of its primary energy consumption. Korea has the highest contribution from nuclear, 14% of primary energy consumption (Japan ranks second, with 11%).
If 5% growth in energy usage were to continue for the next 30 years, annual consumption would rise more than fourfold. This may not be possible: energy supply may be unable to meet such demand, and a look at the energy mix for different countries has been illuminating. However, there is little discussion of low-growth or no-growth scenarios, or of quality-of-life goals to replace GDP with more appropriate targets.
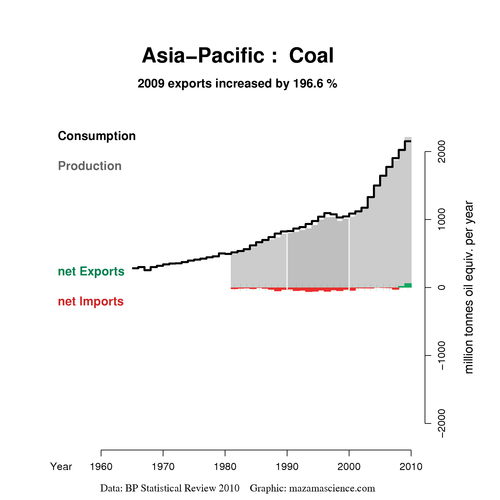
Consumption of coal has been growing faster than other fuels: it doubled in the last 10yrs - a compound annual rate of 7%. Coal now accounts for 51% of Asia's primary energy consumption, compared to 17% in the EU, and 25% in the US. Asia accounted for 60% of the world's coal consumption in 2008, compared to 25% 30 years earlier. China and India are both heavy users of coal.
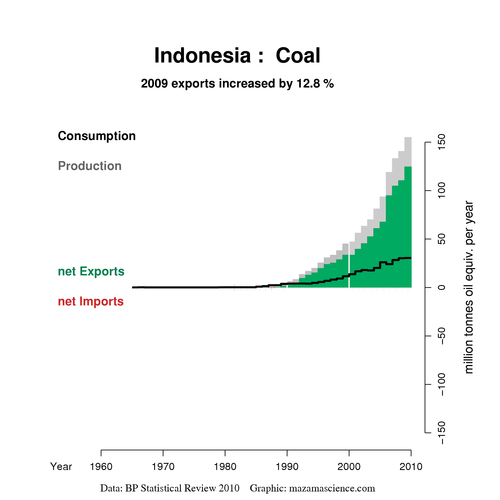
Consumption of coal in Malaysia and Indonesia has been growing especially fast: more than threefold for each country in the last 10 years, compound growth of over 12%. (No wonder our air quality has been deteriorating.)
Greater China, Japan and Korea together accounted for 75% of Asia's 2008 energy consumption. India represented 11%, and five south-east Asian countries (Indonesia, Thailand, Singapore, Malaysia and the Philippines, ranked by consumption) accounted for only 9%.
Asia's growing net imports of oil...
|
... and of gas
|
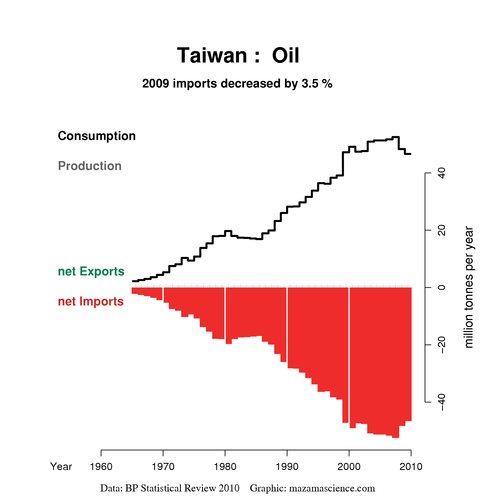
Regional oil production has been on a plateau for well over a decade (see chart on the left above), and represents a dwindling proportion of oil consumption, which is still rising. Therefore, net oil imports are increasing.
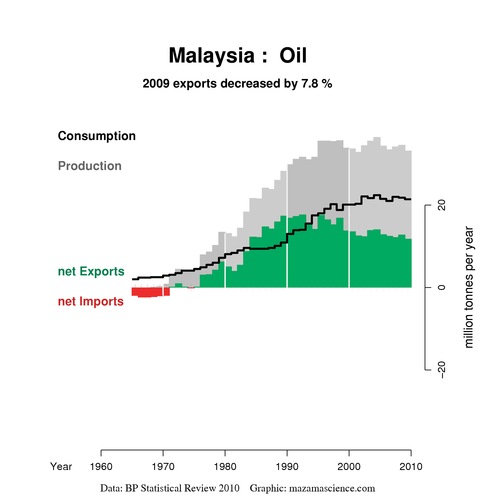
The map above that shows that almost all countries in the Asian investment region are net importers of oil. The only net exporters are Malaysia and Vietnam - in terms of land area, tiny specks on the map! The major oil and gas reserves of the Middle East, Central Asia, Russia, and East Africa are neighbouring, but it seems worthwhile to examine the growing import-dependence and dwindling self-sufficiency of the area in which Asian funds have historically invested.
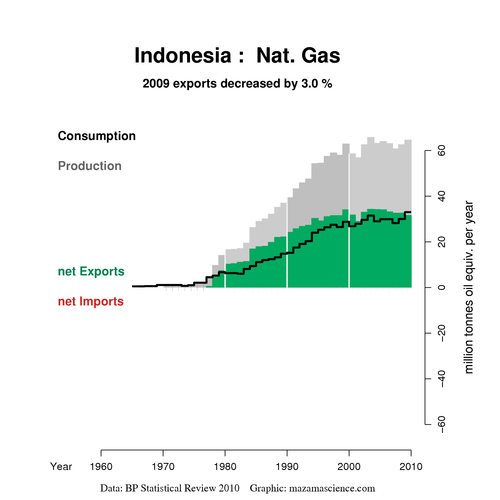
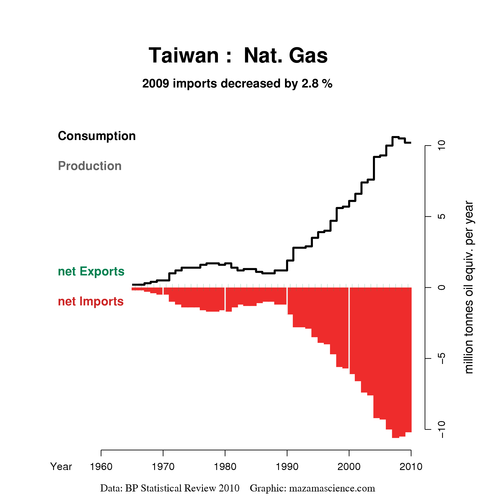
Regional gas production is still rising (see chart above right), but not as fast as regional consumption. Net imports are increasingly important, to fill the gap. Malaysia and Indonesia are the world's second and third largest exporters of LNG - significant players, but limits to growth are becoming apparent. Australia's gas exports are currently much smaller, although this may change with the large new projects.
Note the figures on the differently-scaled y-axes of the oil and gas charts. Asia-Pacific gas production now almost matches its oil production. In 2008, Asia-Pacific oil production was 381m tonnes, and gas production 370m tonnes of oil equivalent. But oil consumption is a multiple of gas consumption: for 2008, 1,183Mt, v gas 437Mtoe. The region remains very dependent on oil, which represents 30% of its primary energy consumption.
For Asia, excluding Australia/New Zealand, 2008 production was 357Mt of oil, 332Mtoe of gas. The antipodeans accounted for only 6% of Asia-Pacific oil production, and 10% of gas production. China represented 50% and 19%, respectively.
Regional coal production, like consumption, is rising fast. There is much trade between countries, but the region as a whole has been self-sufficient in coal.
I'll now turn to individual countries: first the two giants expected to dominate demand growth, then two of the fading producers, followed by a quick overview of the rest. A few charts will be shown on this page, but many more will be linked, and the ones I would particularly like readers to look at will be starred*. For those who have time, I recommend looking at all the linked charts (or directly at the Databrowser): I found it illuminating.

China's energy consumption has accelerated in the last decade, but in the 30 years to 2008 it grew 4.9 times, representing compound growth of 5.4% pa.
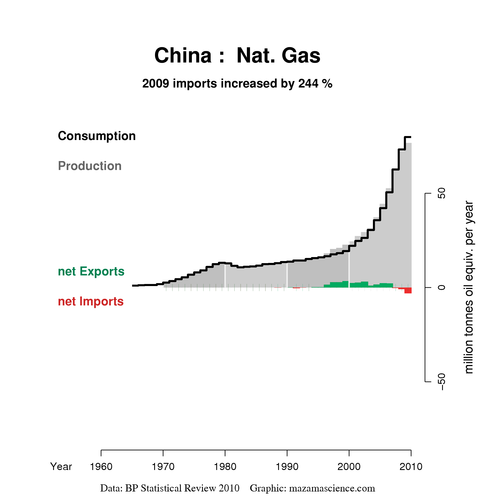
Coal accounts for 70% of China's primary energy consumption, as noted above. China is the dominant coal producer in the region: in 2008, it accounted for 76% of the coal production in Asia, and 69% of that in Asia-Pacific. China's coal production matched consumption until 2008; in that year it accounted for 42% of world coal consumption. It has since become a net importer.¹.
China's oil production continues to rise slowly, but oil consumption has been rising much faster*. China used to be self-sufficient in oil, and became a net importer only in 1993. Since then, net imports have been growing fast. Imports accounted for 52% of China's oil consumption in 2009.
China's gas production has been rising fast, and demand has been rising even faster, with the rapid building of gas distribution systems. Actual consumption has been constrained by availability, but the shortfall is expected to ease with the completion of some major pipelines, such as the Turkmenistan-China gas pipeline. Net imports of gas are just beginning, and expected to grow rapidly.
China's nuclear and hydro-power production are both increasing fast, but remain a small proportion of the energy mix. (To see charts of these, go to http://mazamascience.com/OilExport/, and look at China, import/export, the respective fuel.)

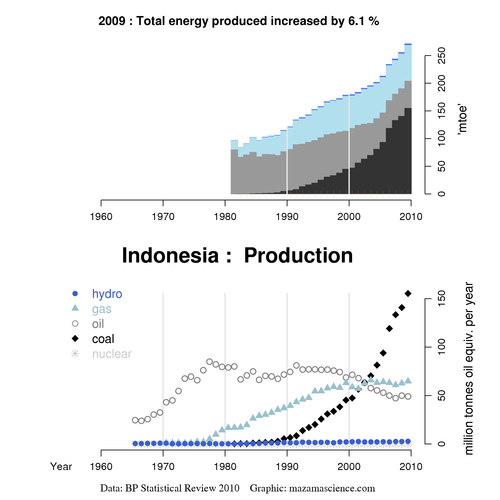
Indonesian oil production peaked in the 1970s, and then plateaued for 20 years before starting a clear trend decline. Consumption in the 1970s was a small fraction of production, but has grown 3.6x in the last 30yrs (compound growth of 4.4% pa), and has exceeded production for the last five years. Indonesia has been a net importer of oil since 2004, and is an excellent example of the Export Land Model - on which there is a good Wikipedia page.
Indonesian gas production started just as the oil production peaked. It grew fast until 2000, and has since plateaued. Consumption is still rising, so net exports are falling. Indonesia is currently the world's third largest exporter of LNG, after Qatar and Malaysia.
Coal production and consumption have grown from nowhere over the last 15-20 years, with a big jump a few years ago roughly coinciding with the shift to net imports of oil and falling net exports of gas.
Over the last 20 years, Indonesia has grown its energy production 2.4 times*, 4.4% pa, by using more and more coal. Coal production over the period increased 51 times: clearly this pace is unlikely to be sustainable for the next 20 years. Given fast-rising domestic demand for electricity generation, coal exports may be capped or phased out. The House of Representatives just approved the building of nuclear power plants.
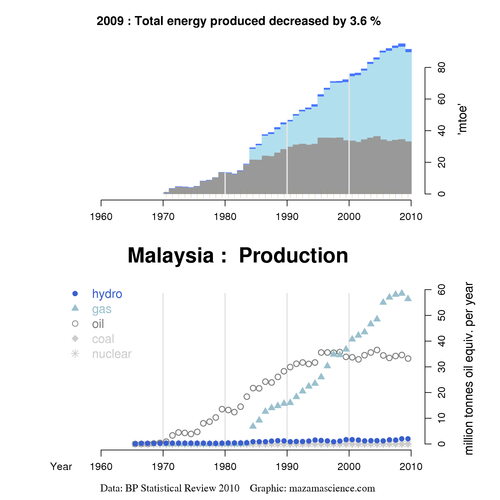
Malaysia has been a lucky country: blessed by a large land area with huge natural and mineral resources. It has been slashing and burning through this legacy without much evident thought for the future, partly because the land area seemed huge and resources abundant - until used up by a rapidly growing population. The hardwood timber has been exploited, oil palm monoculture has replaced the rainforest, and sealife has been decimated. When oil production levelled off, gas production soared, ensuring continued growth in total energy output. Malaysia still enjoys an energy surplus, but trends in the individual fuels suggest that it would be prudent to be less profligate with this bonanza.
Malaysia is a net importer of coal. Now this chart is truly scary for asthmatics*. But it is explained by the oil & gas charts...
Malaysian oil production has been on a plateau since about 1995. Consumption carried on rising for longer, so net exports are significantly below their peak of the early-mid 90s. (The Malaysian stock exchange in 1993 was regularly trading more than the NYSE - a speculative bubble, but one that is hard to imagine today. As in the UK, there seems to have been some correlation between times when the population felt most prosperous and exuberant, and the greatest oil windfalls.)
Malaysian gas production has continued to rise, and goes roughly 50/50 to local use and to exports. All production from East Malaysia is exported. The US EIA says "there are several important ongoing projects that are expected to expand natural gas production in Malaysia over the near term" (www.eia.doe.gov/emeu/cabs/Malaysia/Full.html). The Peninsula however has been suffering from gas shortages. LNG is to be imported from Australia from 2014, and national electricity supplier TNB has been arguing for nuclear power on the basis that it currently depends on Terengganu gas which may be gone by 2019.
Singapore historically bought piped gas from Indonesia and Malaysia, but is now assuming they may in future have none to spare, and is building an LNG terminal so that it can import gas by ship from other sources.
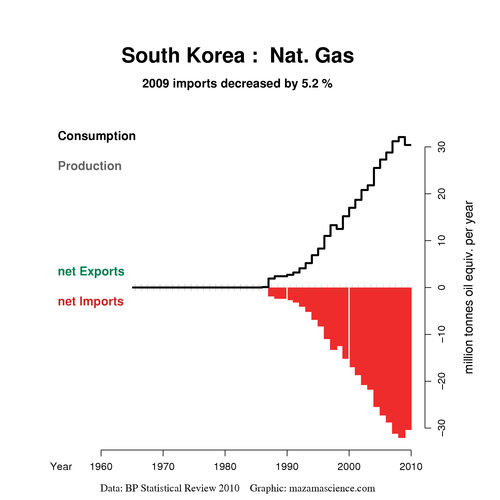
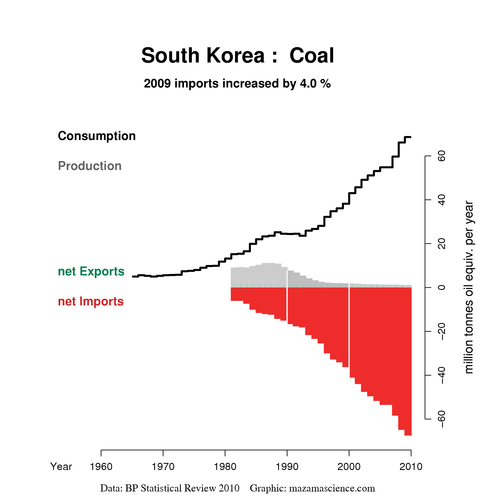
South Korea's energy consumption is still growing, and it imports all of its oil and gas. Korea used to produce coal, but since the mid-90s has been almost entirely dependent on imports. Its nuclear output has been increasing, but as noted above this still represents only 14% of the energy mix.
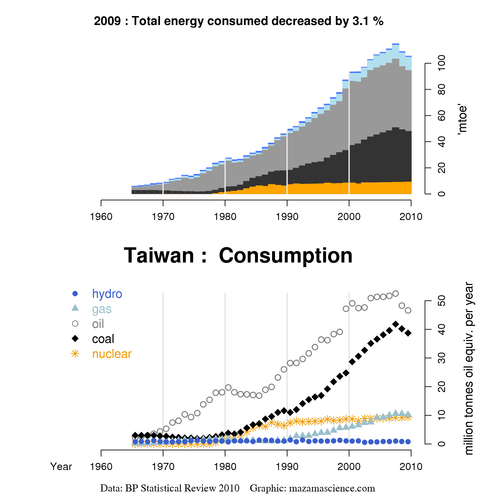
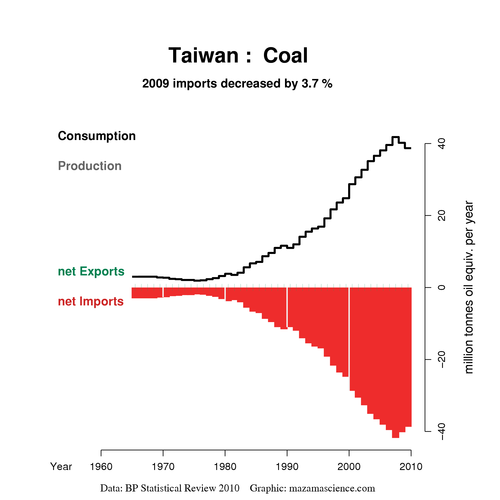
Taiwan, likewise, produces nuclear power, but it represents only 8% of the energy mix. It depends on imports for oil, gas, and coal.
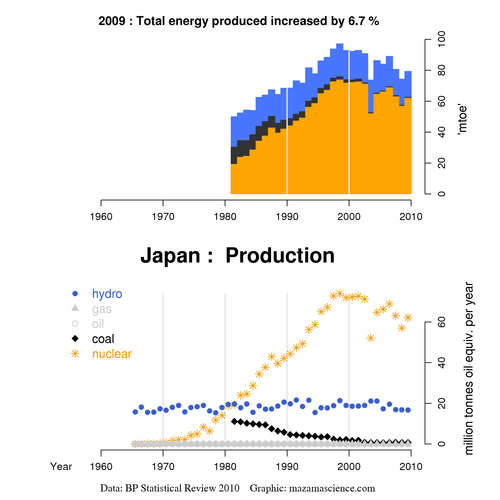
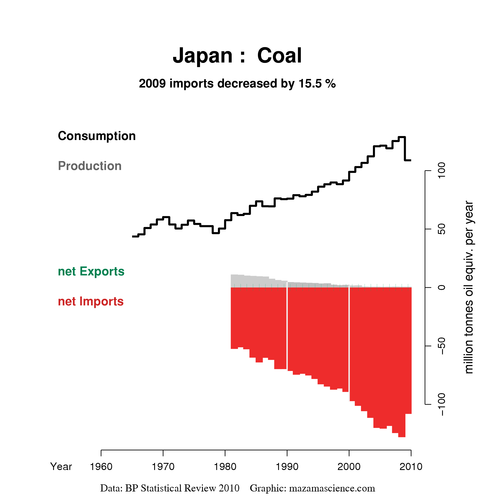
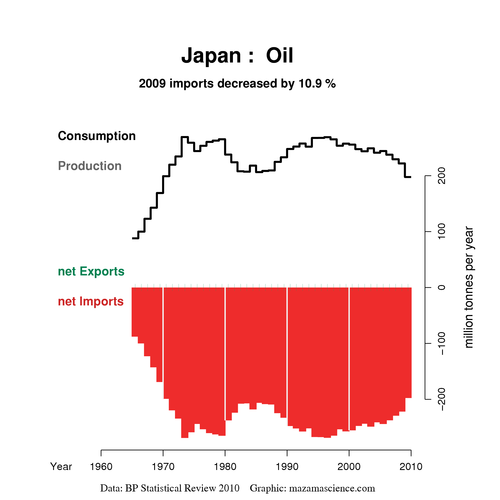
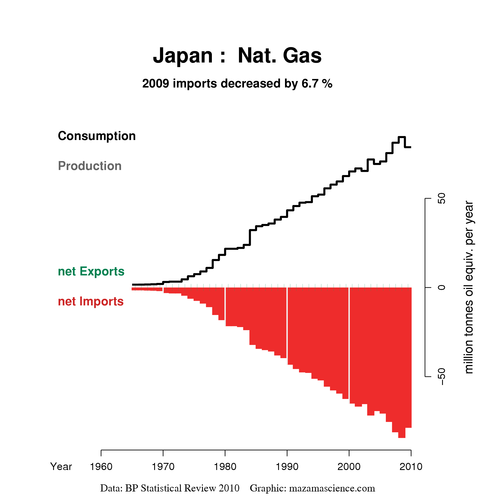
Japan's energy consumption has flattened out. Oil predominates, but there is a growing proportion of coal in the mix. Nuclear production has been falling, leaving it increasingly dependent on fossil fuels. Like Korea, Japan used to produce coal, but is now almost entirely dependent on imports - as it is for oil and gas.
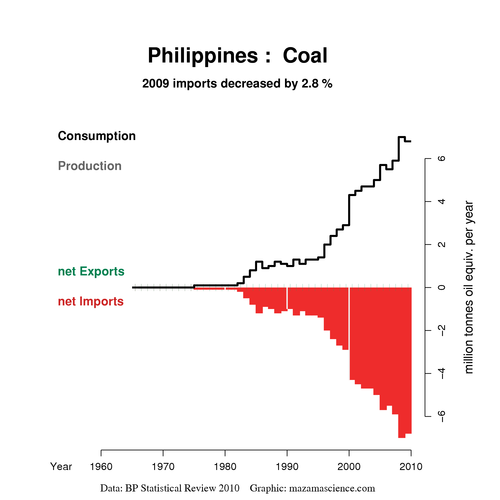
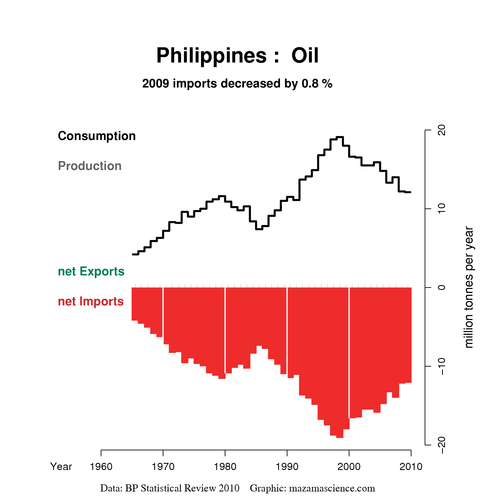
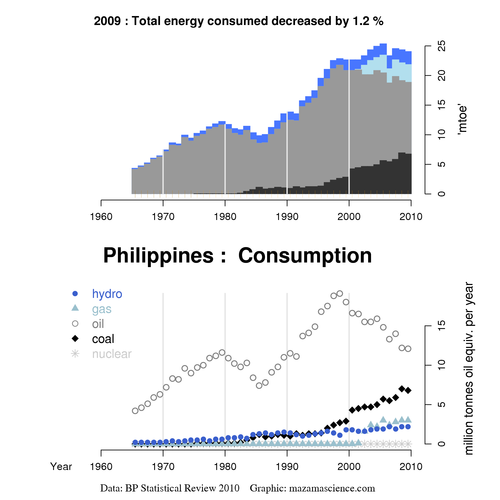
The Philippines' coal consumption rose 4.3 times since 1995*: compound annual growth of 12%. Consumption of oil fell 27% over the ten years to 2008, but all is imported, and it remains the largest part of the energy mix. The Philippines, like Japan, Korea, Taiwan, and now India, is a net importer of all three fossil fuels. Unlike the others, it has no operational nuclear facility, but is among the world's major users of geothermal power.
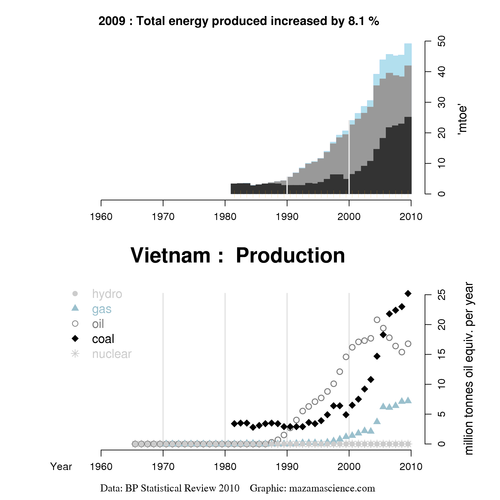
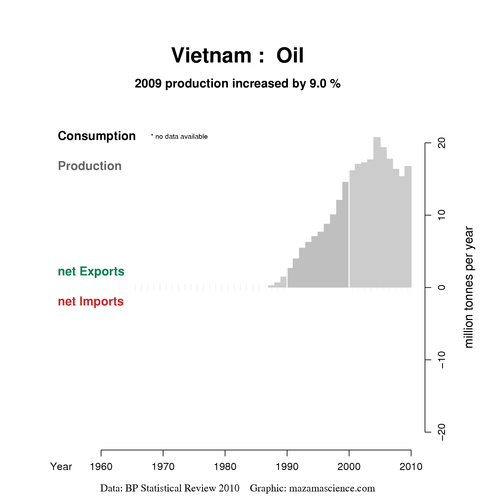
Vietnam's coal production has been soaring. It grew 3.7 times in the 10 years to 2008: annual compound growth of 14% pa. Coal has overtaken oil production. Vietnam is currently a coal exporter, but is expected to become a net importer by 2013. Vietnam's oil output peaked in 2004*, and fell 26% over the next four years, although it increased again in 2009. Gas production is smaller, but continues to grow.
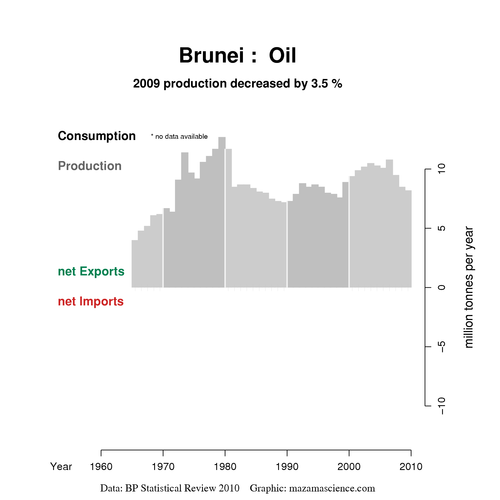
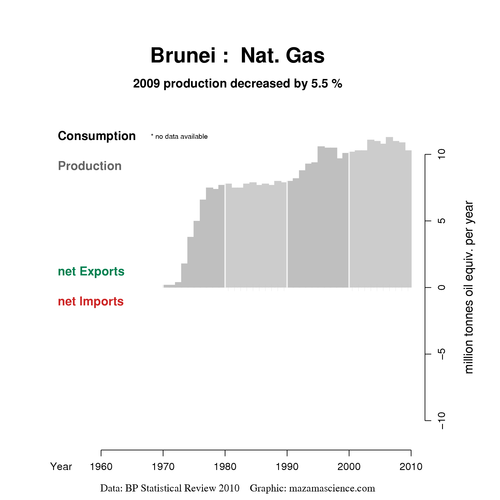
Brunei's oil production peaked in 1979*, ostensibly (as in Malaysia) to prolong reserve life. Gas production has continued to grow, but only slowly.
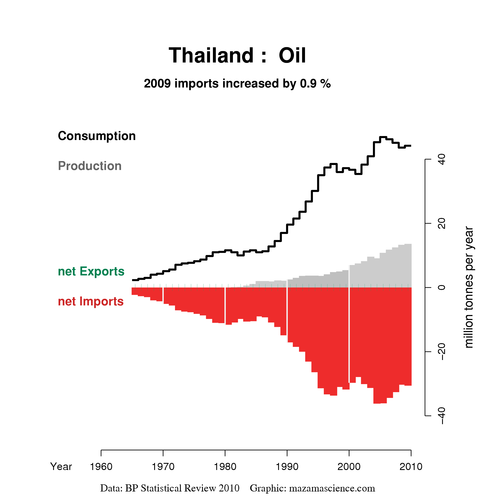
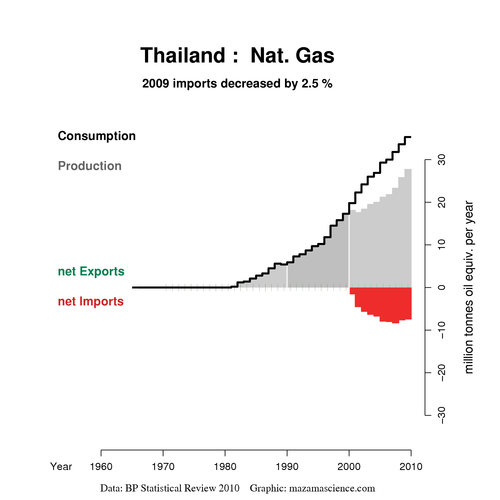
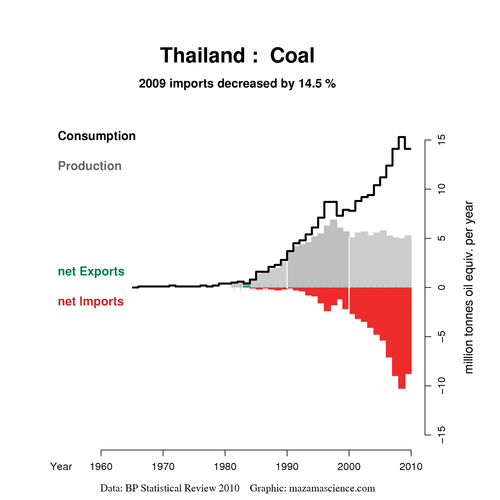
Thailand's oil production has been growing since the 1980's, but covers only 36% of consumption. Gas production continues to grow, but gas consumption is growing faster*: it has been a net importer since 2000. Coal consumption rose 6.8 times* over the last 20 years: coal production peaked in 1997, so net imports have been soaring.
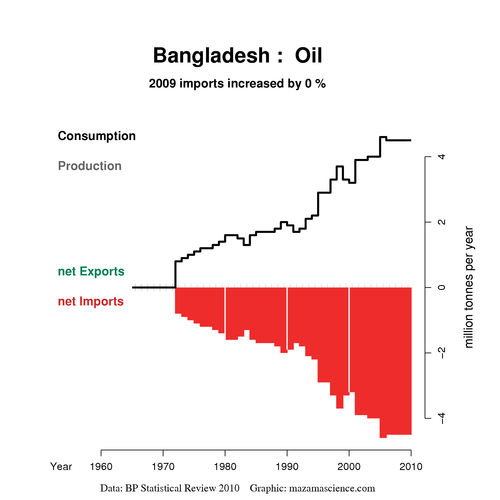
Bangladesh is mainly dependent on gas: locally produced and consumed, and representing 75% of the formal energy mix. 22% is from oil, all imported.².
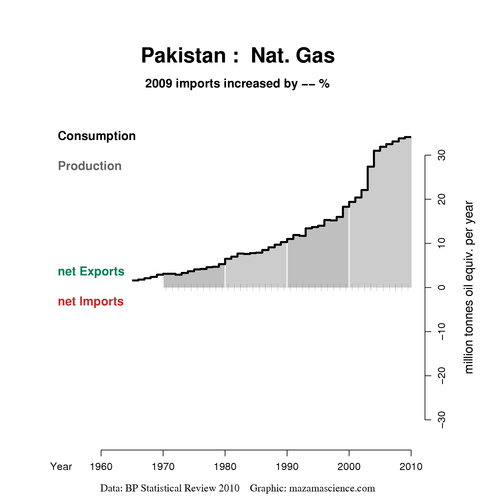
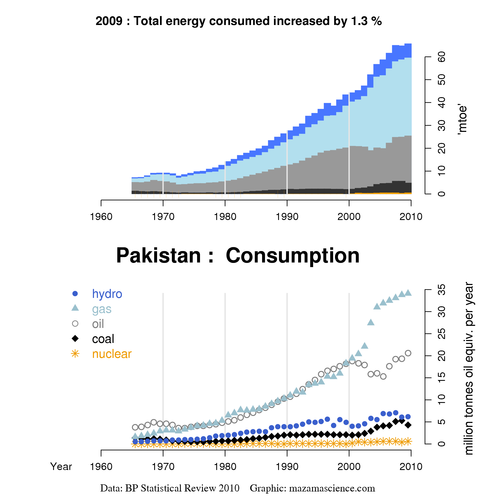
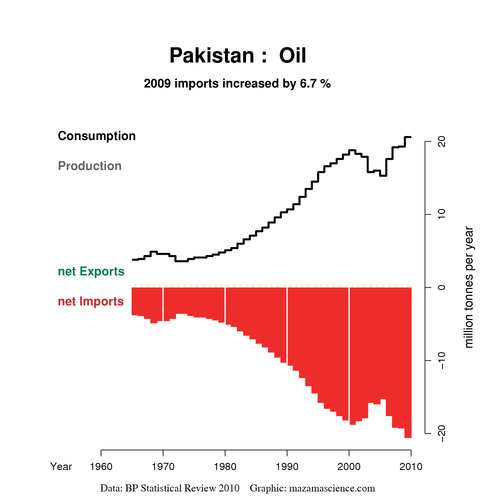
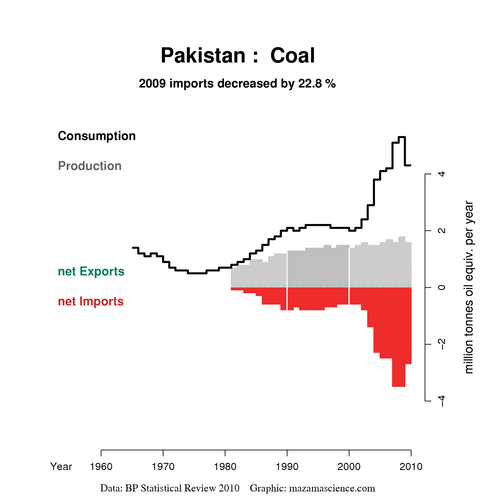
Pakistan also consumes all the gas it produces, and needs the planned pipeline from Iran. Meanwhile it has a more diversified energy mix. It has been suffering major blackouts, and wants a nuclear energy programme. Oil and coal are imported.
Asian oil consumption continued to grow throughout the eightfold 2001-08 price increase and the 2008-09 downturn, whereas developed countries experienced some consumption cutback in response to rising prices. Despite lower incomes, it now seems that developing countries are less affected by high oil prices than the US, partly because of smaller vehicles (including scooters and electric bicycles) and still-functioning public transport systems³. One likely exception is Malaysia, where the pursuit of a Los Angeles development model has left the country vulnerable.
In the event that global oil supply is inadequate to meet the growth in demand which would otherwise occur, it therefore seems likely that the developing countries may be able to outbid the developed countries and command a growing share of the oil (and gas, and coal) available. They may not, however, be able to get all they want; and if prices are higher that may adversely affect the customers for Asia's export machine.
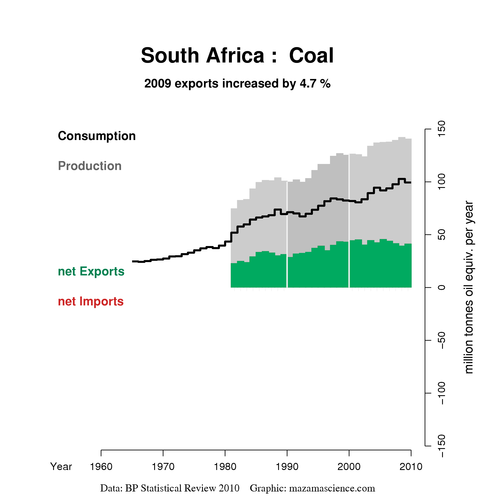
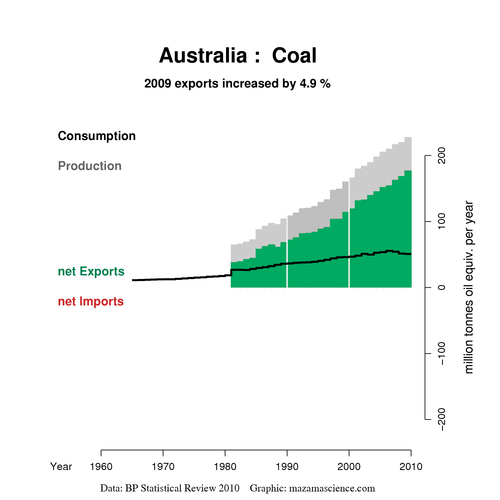
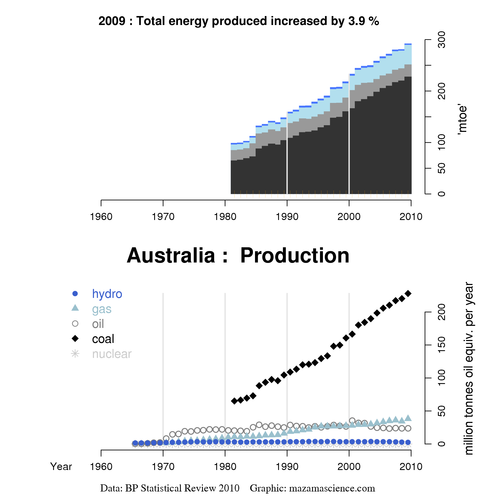
The remarkable growth of coal consumption in Asia looks set to continue, regardless of carbon emissions - subject to availability, which is increasingly dependent on Australia. Asia-Pacific exporters - Australia, Indonesia, China, Vietnam and Indonesia - currently supply 66% of world seaborne trade in thermal coal; Australia alone supplies 64% of the trade in coking coal. With Korea, Thailand, China and India no longer self-sufficient; and Vietnamese, Indonesian, and South African exports dwindling, Australia's expanding coal production should be readily taken up. Australian coal reserves are said to be huge: 76bn tonnes in 2008. In that year, coal accounted for 79% of Australia's primary energy production.
Gas will be developed to the extent available. The number of countries using nuclear energy seems likely to rise dramatically. For all this, it may not be possible to assume, as one could in the past, that any shortfall in energy availability could be made up at a price.
I ran some numbers for energy consumption in Asia - defined for this paragraph to include Japan and the Indian subcontinent, but to exclude Australia, New Zealand and Central Asia. In the 6 years to 2008, Asia's primary energy consumption grew at a compound rate of 6.7% pa; 69% of the growth came from coal, 13% from oil, and 11% from gas. If over the next twenty years, energy demand is to rise at a more modest 5% pa - many investors would be disappointed if GDP growth is less, and we've yet to see convincing evidence that the energy intensity can be reduced - then annual primary energy consumption would grow to 10,204 Mtoe, 6,358 Mtoe above the 2008 level. Let's assume that Asia builds nuclear capacity as fast as possible. The World Nuclear Association's high scenario, based on announced and updated plans, including very aggressive buildout by China, India and Pakistan, and new nuclear programmes by six of the ten ASEAN countries plus Bangladesh, currently (19Apr) envisages an additional 387GWe of capacity in Asia by 2030, equating to 744Mtoe4. There are considerable doubts as to whether this rate of expansion will be achieved in practice, but let's take this as the maximum contribution: nuclear would then represent 12% of the increase in Asia's energy demand, compared to 3% of current consumption. Hydro probably cannot contribute much more than it does already; wind, solar, biomass etc seem unlikely to help significantly. There are major new gas sources, in Australia (Australia / New Zealand gas output is forecast to grow 4.2% pa), and via pipelines from Russia and Central Asia - which is just as well, given the oil and gas trends noted above. It seems likely that coal will have to contribute at least 50% of the ex-nuclear increase in consumption: on the numbers above, that means 50% x (6,358-744) or an additional 2,807 Mtoe - or as in the recent past, a higher percentage, but that "conservative" 2,807 Mtoe compares to Australia's 2008 coal exports of 169 Mtoe (Colombia's were 45 Mtoe, and South Africa's 38 Mtoe). The same calculations based on 3% growth in Asia's energy demand would result in a 1,178 Mtoe increase in demand for coal. Australia's coal production is expected to increase, but whether coal exporters worldwide are capable (climate and environmental considerations aside) of increasing supply fast enough to meet the demand seems unclear. There may be new sources: among the closest could be Mongolia and the Russian Far East, both said to have large coal reserves. However, energy availability may be a constraint on Asia's (and the world's) ability to grow at the rates commonly assumed by investors.
Claire Barnes, 23 March 2010
(updated 15 & 19 April 2010; and charts only on 16 June 2010)
Previous reports:
| Home | Investment philosophy | Fund performance | Reports & articles | *What's new?* |
| Why Apollo? | Who's Claire Barnes? | Fund structure | Poetry & doggerel | Contacts |